Alerts view
Check the run-time behavior of your platform by monitoring your alerts.
Here you can choose a range of dates or a pre-defined range (last week, last month, last quarter and last six months).
Ways to use this view
If you're a platform admin, you can use this view to monitor important metrics about your platform, such as user adoption, transaction or job time.
What data is shown
The Alerts overview view shows the following information:
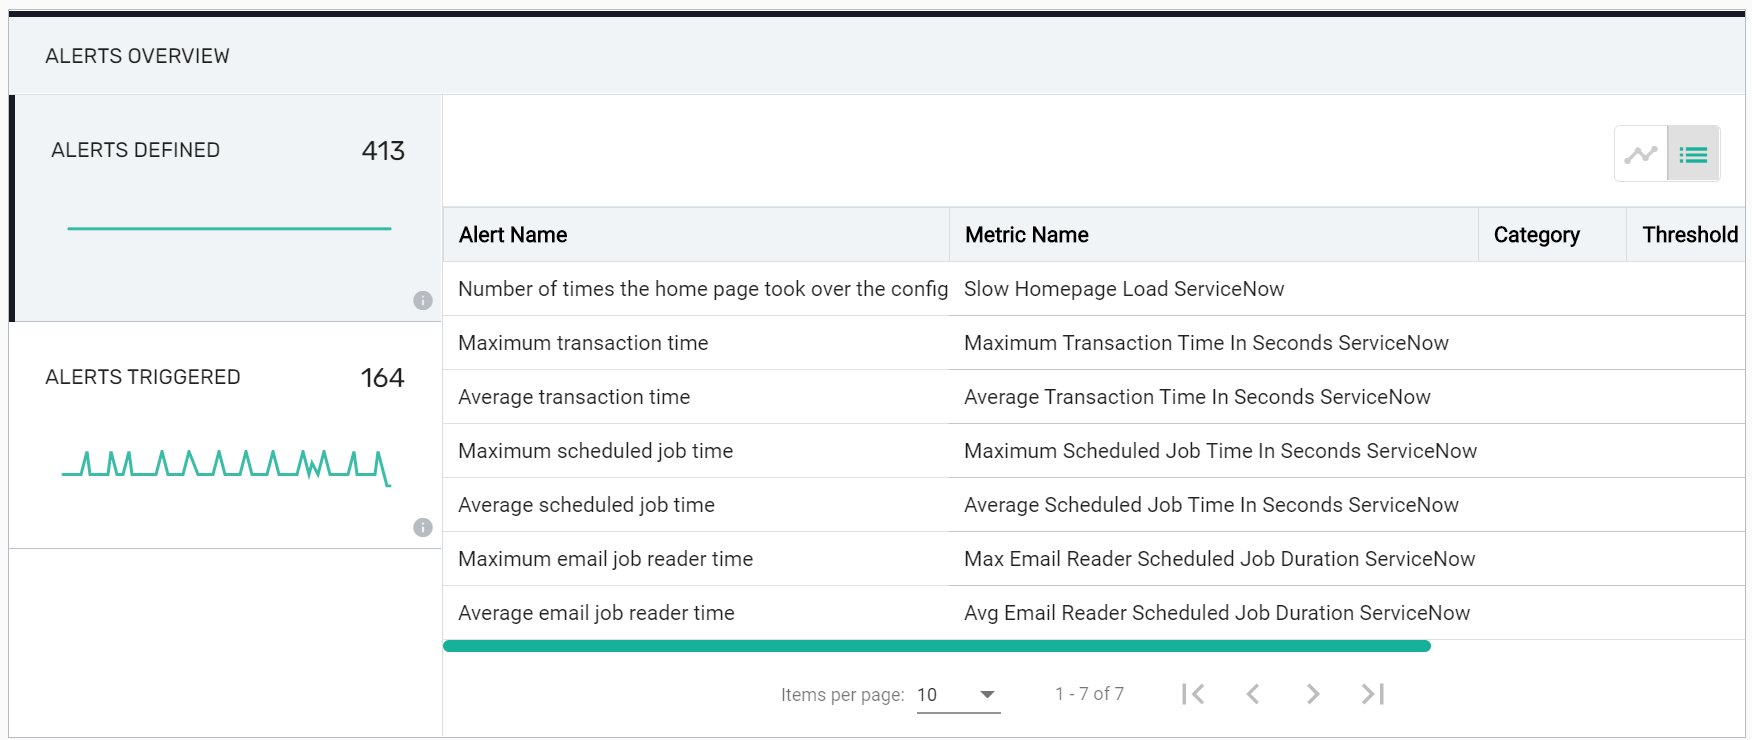
Alerts defined
See the information about all the alerts defined for the instance.
Widget
The widget shows you the following elements:
- The total number of alerts defined for the instance
- The trend over time
Trend - Alerts defined over time
The trend shows the visual representation of the progression of alerts defined for the platform over time.
Grid
See the alert name and the metric name for all the alerts defined for the instance.
Alerts triggered
See all the information about alerts that have been triggered for your instance.
Widget
The widget shows you the following information:
- The total number of alerts that have been triggered for your instance in the selected time range
- The trend over time
Trend - Alerts triggered over time
The trend shows the visual representation of the progression of alerts triggered by the platform over time.
Grid
See the details of all the events which triggered the alerts in the selected time range, including date and the value of the metric which triggered the alert.